Chapter 2: ABC Analysis
I. IQ Data Analysis (Analysis by Item)
IQ Analysis is a method used to analyze the shipment volume (Quantity) for each item (Item).
- Application of ABC Analysis
Items are sorted by shipment volume and classified into three groups: A (High volume), B (Medium volume), and C (Low volume). This is essential for inventory management and distribution center planning.
- The "80/20 Rule" Application
Generally, 20-30% of all items (I20–I30) account for 80% of the total shipment volume (GIQ80).
- Analysis Tools
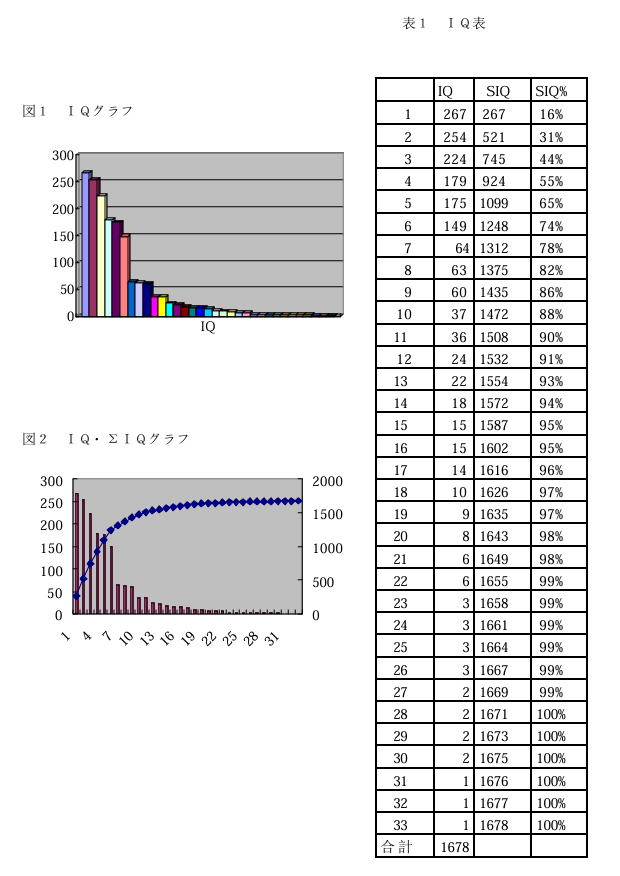
- IQ Table: A summary table of quantities and cumulative composition ratios.
- IQ Curve (Pareto Chart): A graph visualizing the distribution of shipment volumes. Often shown with the "ΣIQ Curve" (cumulative values).
- ABCD Analysis
Items within the C group that rarely move or have zero shipments are distinguished as D group (Dead stock) to evaluate inventory health.
II. EQ Data Analysis (Analysis by Customer)
EQ Analysis is a method used to analyze the order quantity (Quantity) for each customer/order entry (Entry).
- Importance of the Logistics Perspective
Instead of analyzing based on sales value (commercial flow), analysis based on "Quantity" allows for accurate assessment of logistics workload.
- Distribution Trends
Similar to IQ analysis, it is common for 20-30% of all customers (E20–E30) to account for 80% of the total order volume (GEQ80).
- Analysis Tools
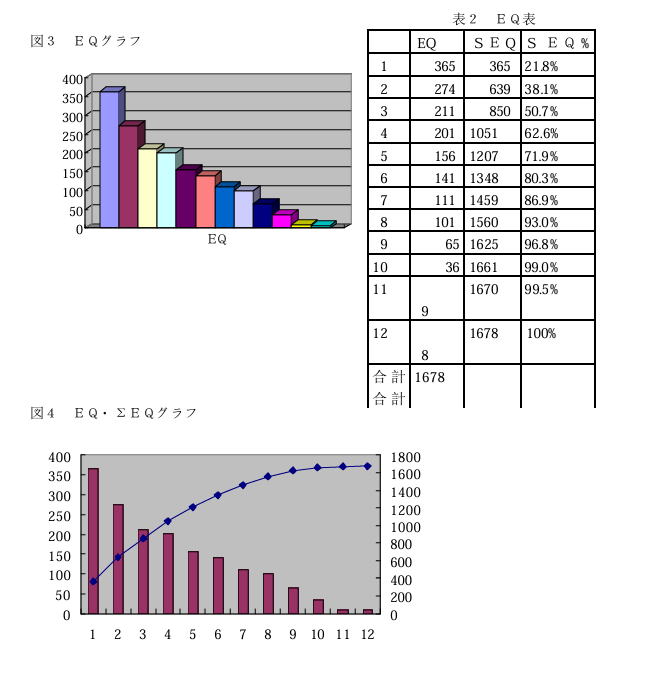
- EQ Table: A table ranking order quantities by customer.
- EQ Curve: A graph visualizing customer bias. It confirms whether logistics workload is concentrated on specific customers.
Summary: Roles of IQ and EQ Analysis
- IQ Analysis: Decides "Which items should be managed intensively?" (Storage location, replenishment frequency).
- EQ Analysis: Decides "Which customers have the greatest impact?" (Packing methods, delivery routes).
Combining these two analyses makes it possible to build the optimal layout and work system for a distribution center.