Chapter 8: EIQ Radar Chart
I. Definition and Purpose
- Overview: A graph that visualizes the scale and characteristics of a distribution center using EIQ analysis data.
- Core Uses: Used to identify the "personality" of a center and as a benchmarking tool for productivity and scale.
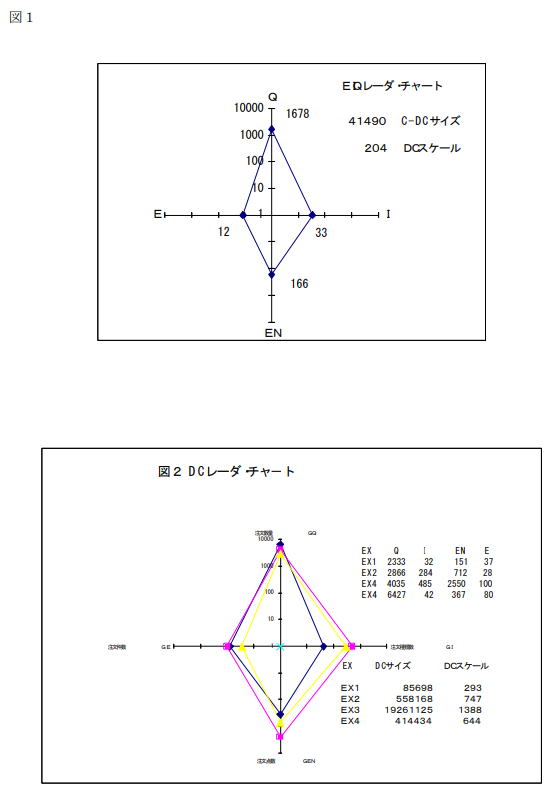
II. Chart Configuration and Axes (Fig. 1)
The chart connects the following four indicators as axes to create a diamond shape:
- Horizontal Axis (Left): Number of Order Entries (E)
- Horizontal Axis (Right): Number of Shipped Items (I)
- Vertical Axis (Top): Shipped Quantity (Q)
- Vertical Axis (Bottom): Number of Order Lines (EN) *Synonymous with Shipment Overlap (IK)
III. Perspectives on Comparison and Classification
Capturing the workload as an "area" allows for multi-faceted comparisons:
- Daily Fluctuation: By creating charts daily, one can grasp changes in workload and trends in shipment characteristics.
- Site Comparison: Compare multiple centers by area and shape to judge similarities in scale and traits.
- Industry Characteristics: Compare differences in shape based on industry, such as automotive parts (high variety) vs. food manufacturers (low variety).
IV. Graph Scale Settings
- Selection Criteria: Use a normal scale, or a logarithmic scale if the numerical range is large.
- Recommendation: Since EIQ data typically has a wide numerical range, using a logarithmic scale helps visualize the distribution in a balanced way.
V. Multi-faceted Evaluation (Benchmarks)
Utilized as an evaluation index for management resources and efficiency in the following areas:
- Productivity & Cost: Comparing productivity when combined with total work hours, and calculating logistics costs.
- Resource Optimization: Determining appropriate staffing levels and understanding the relationship with equipment.
- Operational Efficiency: Understanding the usage efficiency of logistics equipment and the impact of changes in shipment characteristics.
VI. DC Size and DC Scale
Indicators used to quantify the scale of operations.
1. DC Size (Work Area)
- Represents an outline of the workload as an area, using units such as P, C, or B.

2. DC Scale (Work Yardstick)
- The square root of the DC Size, acting as a general yardstick for intuitively comparing operation scales.
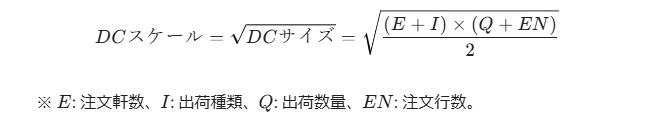
*Note: These are "rough guidelines" and do not represent exact, rigid figures.
Fig 2: Comparison Example of EIQ Radar Charts (DC Size/Scale) between Companies